I grew up on Lake Superior, which is a strange thing to say to anyone who has not swum in it. The water is cold enough that you lose your breath on entry and you spend the first ten seconds deciding whether this was a mistake.
It never was. You warm up, you stop noticing, and then you are out on the rocks in the sun with your lips going slightly blue and your parents calling you in for lunch.
Later there were summer camps, and summer camps meant a beach or a dock, a swim test, and a rope line you were not allowed to cross until an instructor said you could. Nobody in that entire stretch of my childhood ever asked whether the water was clean. The water was the water. You jumped in.
Wild swimming is just what we used to call summer
There is a term for this now. Wild swimming, meaning swimming in open natural water rather than a chlorinated rectangle. It has become a whole category of travel, complete with gear, guides, and a small industry of people explaining cold exposure.
I find the branding a little funny, because it describes the default state of a Canadian childhood. But I am glad it exists, because it has pulled a generation of families back toward the water. As a parent, I encourage it. Our kids swim in lakes. They jump off docks. They come out with that particular look on their face that I recognize when I was ten years old at Dorion Bible Camp.
What almost none of us consider, standing on that dock, is the chemistry of the water we are about to jump into.
What began as a research project became the most-read page we publish
For each of the last three years, the team at Lake.com has published a study ranking the cleanest and dirtiest large lakes in America. The data comes from the National Water Quality Monitoring Council, accessed through waterqualitydata.us, which aggregates readings from federal, state, tribal, and local monitoring programs.
It started as an internal research project. We wanted to understand the destinations travelers actually visit, at a level of detail that generalist travel platforms do not model. Water depth, shoreline type, dock access, and yes, water quality.
It has since become a highlight of the year. The report is consistently one of our most visited pages, cited by journalists and used by travelers planning a trip to a lake near them. People want to know. They just did not have anywhere to look.
Eight indicators, equally weighted, scored out of ten
The methodology is deliberately simple because a composite index that requires a footnote for interpretation is not useful to a family choosing a beach.
We score eight indicators, weighted equally: dissolved oxygen, ammonia, lead, phosphorus, sulfate, total dissolved solids, turbidity, and deviation from a neutral pH of 7. Each lake receives a composite score out of ten, where higher means dirtier.
Two rules govern the sample. We use the most recent 12-month median for each lake, based on data reported between January 2026 and July 2026. Any lake reporting fewer than three of the eight indicators is excluded rather than estimated. Of the 100 largest lakes screened this year, 67 carried enough official data to be scored.
Large lakes are broadly clean, and the exceptions are chemical rather than biological
That is the headline, and it is worth sitting with before anyone panics about a ranking.
America’s largest lakes remain, on the whole, clean and pleasant to swim in. Even the lakes at the top of our dirtiest table sit within the range you would expect for large natural bodies of water. The gap between the average score of the dirtiest ten and the cleanest ten is 8.4 times, which sounds enormous until you see what drives it. It is rarely sewage or algae. It is mineral load, and mineral load is mostly a function of hydrology.
The cleanest water is cold, deep, and well flushed
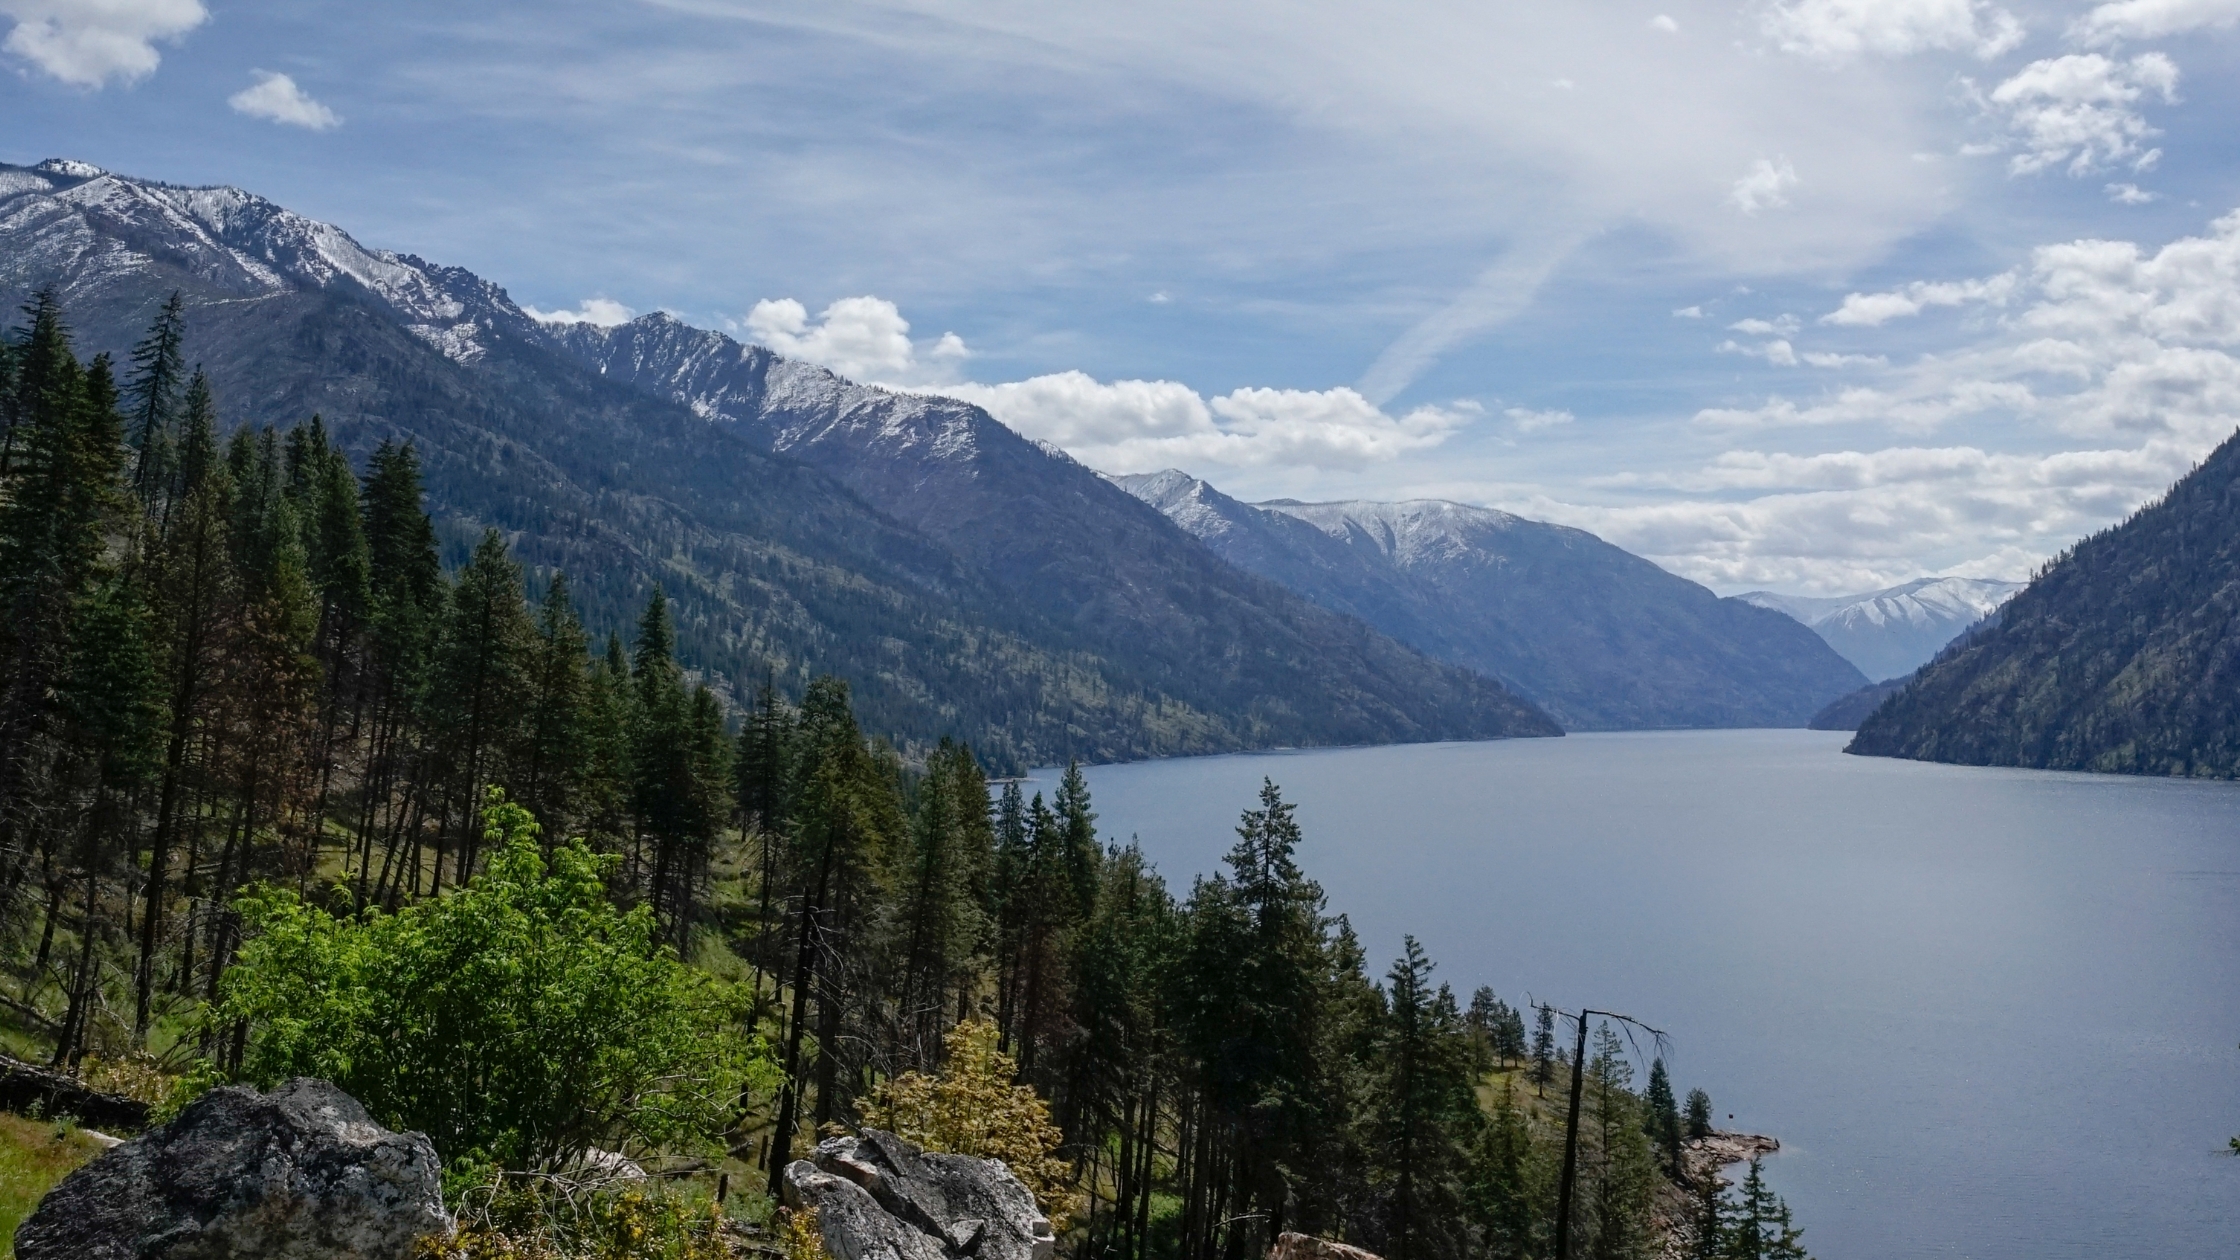
Lake Chelan in Washington took the top spot with a perfect score of 0.00. Turbidity of 2.00 NTU, total dissolved solids of 30.25 mg/L, and sulfate at 3.65 mg/L. Extremely clear, and one of the lowest mineral loads in the entire study.
| Rank | Lake | State(s) | Score /10 |
|---|---|---|---|
| 1 | Lake Chelan | Washington | 0.00 |
| 2 | Lake Superior | MI, MN, WI, ON | 0.28 |
| 3 | Lake Martin | Alabama | 0.53 |
| 4 | Rainy Lake | MN, ON | 0.62 |
| 5 | F.D. Roosevelt Lake | Washington | 0.72 |
| 6 | Lake Koocanusa | BC, MT | 0.84 |
| 7 | Lake Michigan | IL, IN, MI, WI | 0.87 |
| 8 | Lake Hartwell | GA, SC | 1.01 |
| 9 | Lake Huron | MI, ON | 1.07 |
| 10 | Kentucky Lake | KY, TN | 1.08 |
I will admit to some personal satisfaction at the second entry. Lake Superior posted 10.58 mg/L of dissolved oxygen and turbidity of 0.54 NTU, the clearest reading in the top ten. The water that took my breath away as a kid is, by this index, close to the cleanest in the country.
The pattern is geographic. Seven of the ten cleanest lakes sit in the Pacific Northwest, the Northern Rockies, or the Great Lakes basin. Cold, deep, and continuously flushed. Water moves through, minerals move with it, nothing accumulates.
The Great Salt Lake is an outlier, not a trend
At the other end, the Great Salt Lake scored 10.00, a full three points above the next-dirtiest lake. Its total dissolved solids reading is 134,500 mg/L, roughly ninety times the next heaviest lake in the index. Dissolved oxygen sits at 3.65 mg/L, the lowest in the study, and ammonia at 0.92 mg/L is the highest in the dirtiest ten.
That result requires context rather than alarm. The Great Salt Lake is not a freshwater lake, and it is terminal. There is no outlet. Water arrives, evaporates, and leaves behind everything it was carrying. The chemistry has nowhere to go, so it concentrates, cycle after cycle, until the readings look extreme. What we are measuring there is hydrology, not upstream pollution.
The regional split makes the same point. Closed basins concentrate minerals, and flushed basins do not. None of the ten cleanest lakes sit in the Great Basin or on the West Coast. Four of the ten dirtiest sit in the Great Plains and Ozarks, three more in the Great Basin.
Read the indicator, not the rank
The most useful part of the report is not the leaderboard. It is the individual readings, because a dirtiest-ten placement is usually driven by one or two measures rather than broad degradation.
Lake Moultrie in South Carolina finished only eighteenth dirtiest overall, yet recorded 17.2 µg/L of lead, the most lead-contaminated reading in the study. Devils Lake in North Dakota had a sulfate concentration of 639 mg/L, the highest we measured, with no natural outlet to dilute it. Lake Mattamuskeet in North Carolina recorded ammonia at 0.67 mg/L, above the 0.53 threshold at which fish are harmed.
None of those three facts is visible from a rank. All three matter more than one.
Uneven monitoring is the real gap
A third of America’s hundred largest lakes could not be scored this year because no one is reliably measuring them. Closing that gap would change the ranking more than any single cleanup effort would.
That is the finding I would most like a policymaker to take from this. We are not short on lakes worth protecting. We are short on data about them.
What I actually do before the kids get in
Very little, honestly, and that is the point.
Monitoring is uneven from one lake to the next, so national data is a starting point rather than a verdict on your specific beach. I check the signage at the access point, because local health units post advisories for a reason and those reflect this week rather than a five-year median. Then we get in.
The report exists to make people more comfortable with the water, not less. Three years of running it has left me more confident than when we started. The lakes are clean. Go swim in them.
The full 2026 report, including all 67 scored lakes and the complete indicator tables, is available at lake.com/company/reports/cleanest-and-dirtiest-lakes-in-america. Or, download a PDF of the full report here.